NeoCartography / Google Earth
This week's focus is on NeoCartography / Google Earth but before I proceed into my gist about this adventure, let me define a couple new terms.
- NeoCartography (literally "new cartography"): is the new way of both representing and communication geographical information. It is informal and lacks thorough academic data analysis.
- Volunteered Geographical Information (VGI): is the use of various tools to create, assemble, and disseminate geographic data provided voluntarily by individuals. It is basically a set of user-generated contents.
- Public Participation Geographic Information System (PPGIS): the inclusion of marginalized population in mapping and GIS academic practices through geographic technology education and participation.
- Other key terms are Geolocation, Geotagging, Cloud Computing and Cloud-based GIS, I believe these terms are self-explanatory.
Now that I have the definition of the key term learned this week out of the way, the primary objective of this lab is to learn how to navigate/use Google Earth using the South Florida Population Density information from Module 10 as our case study.
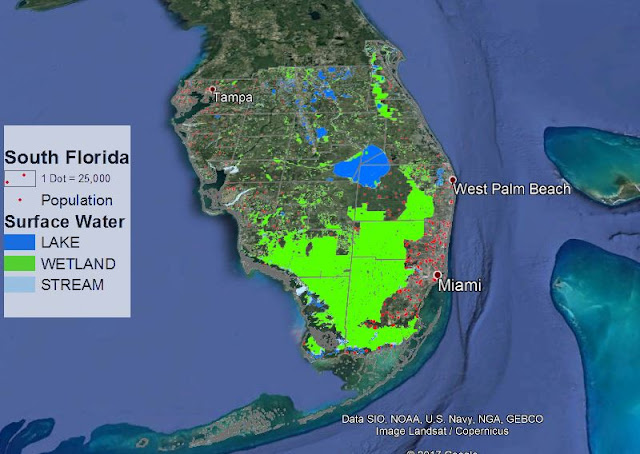
To achieve the module's objective, I started my work from ArcGIS where I edited the legend features of "Population Density Dots" from customed to standard ArcMap depiction of the map features. I then proceed to export two .kmz files ( a zipped version of .kml files) and open it in Google Earth.
Below is a screenshot of South Florida Dot Density map overlayed on a map of Florida from Google Earth.
In Google Earth, I created a fun tour of key locations in South Florida to include but not limited to Miami, Tampa, etc. The tour is not shared in this blog.
The map above shows downtown Tampa Florida.
This, on the other hand, shows downtown of the city of Miami.
This is one of the most interesting modules. I enjoyed every step along the way and look forward to playing with layers of map features to depict real-life data or phenomena.


No comments:
Post a Comment